read "/sample/Lokad_Items.tsv"
read "/sample/Lokad_Orders.tsv" as Orders
read "/sample/Lokad_PurchaseOrders.tsv" as PO
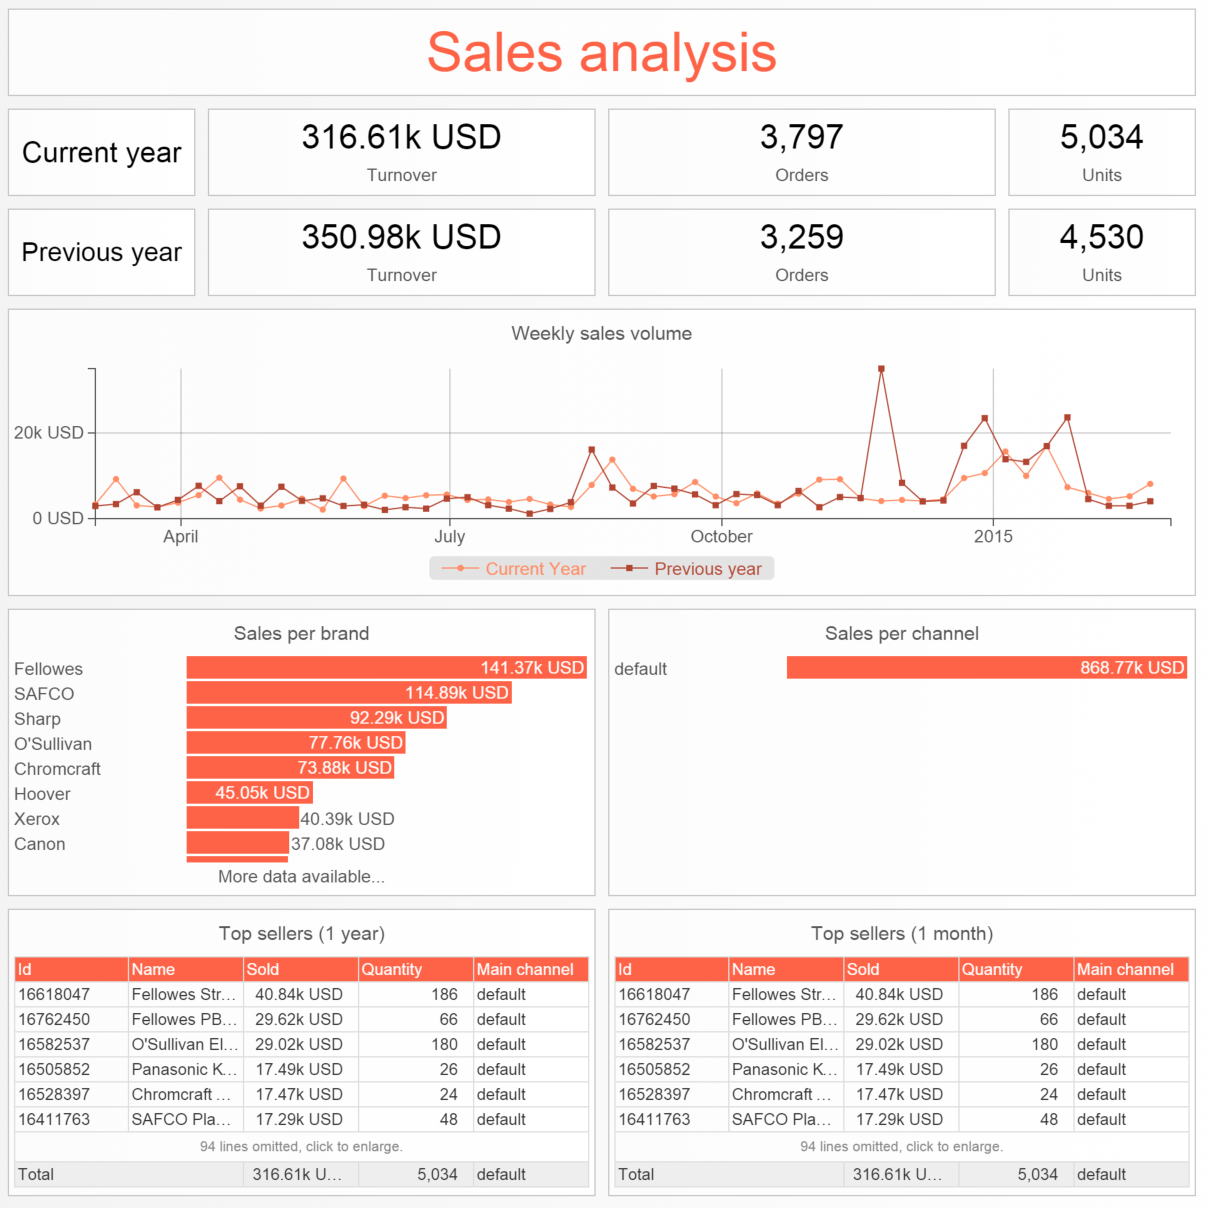
show label "Sales analysis" a1f1 tomato
Orders.OrderId = "\{Orders.Date}-\{Orders.Client}"
Orders.Channel = "default"
oend := max(Orders.Date)
// Moneda predeterminada y conversiones predeterminadas
when date >= oend - 365
currency := mode(Orders.Currency)
Orders.NetAmount = forex(Orders.NetAmount, Orders.Currency, currency, Orders.Date)
PO.NetAmount = forex(PO.NetAmount,
PO.Currency, currency, PO.Date)
// KPI en la parte superior
show label "Current year" a2
when date >= oend - 365
show table "Turnover{ \{currency}}" b2c2 with sum(Orders.NetAmount)
show table "Orders" d2e2 with distinct(Orders.OrderId)
show table "Units" f2 with sum(Orders.Quantity)
show label "Previous year" a3
when date < oend - 365 & date >= oend - 2 * 365
show table "Turnover{ \{currency}}" b3c3 with sum(Orders.NetAmount)
show table "Orders" d3e3 with distinct(Orders.OrderId)
show table "Units" f3 with sum(Orders.Quantity)
// Gráficos de líneas
Week.sold := sum(Orders.NetAmount)
when date >= monday(oend) - 52 * 7 & date < monday(oend)
show linechart "Weekly sales volume{ \{currency}}" a4f6 tomato with
Week.sold as "Current Year", Week.sold[-52] as "Previous year"
// Dividir por marca y por canal
show barchart "Sales per brand{ \{currency}}" a7c9 tomato with
sum(Orders.NetAmount) \
group by Brand order by sum(Orders.NetAmount) desc
show barchart "Sales per channel{ \{currency}}" d7f9 tomato with
sum(Orders.NetAmount) \
group by Orders.Channel order by sum(Orders.NetAmount) desc
// Principales vendedores, principales en ascenso
when date >= oend - 365
show table "Top sellers (1 year)" a10c12 tomato with
Id, \
Name, \
sum(Orders.NetAmount) as "Sold{ \{currency}}"
sum(Orders.Quantity) as "Quantity"
mode(Orders.Channel) as "Main channel"
order by sum(Orders.NetAmount) desc
when date >= oend - 31
show table "Top sellers (1 month)" d10f12 tomato with
Id, \
Name, \
sum(Orders.NetAmount) as "Sold{ \{currency}}"
sum(Orders.Quantity) as "Quantity"
mode(Orders.Channel) as "Main channel"
order by sum(Orders.NetAmount) desc
