Webapp delivering the list of the
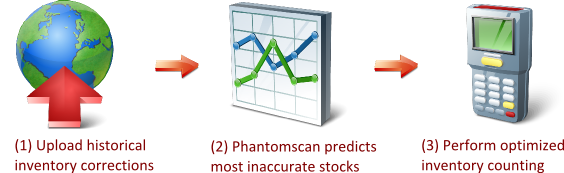
most likely inaccurate inventory records to optimize cycle counting. Let employees focus on items that truly need counting, and ignore others. Based on advance statistical analysis of past inventory controls. Vastly outperform classic cycle counts.
Best suited for retail stores or warehouses suffering from inventory inaccuracies. Complete automation, no statistical skills required. Phantomscan leverages historical data exported from your inventory management system and generates web reports.
Big Picture
Inaccurate inventory records are a widespread problem in retail and supply chain. At the store level, studies (1) (2) show that up to
65% of the records can exhibit discrepancies with the goods available at the expected storage location. Yet, nearly all inventory management systems deployed nowadays rely on the assumption that inventory records are accurate.
Phantom inventory is frequently the primary force causing low
inventory accuracy. The root causes generating phantom inventory are diverse: replenishment errors, customer shoplifting, improper handling of damaged merchandise ...
The traditional approach to get rid of those inaccurate inventory records is
cycle counting. While those audit policies can improve inventory accuracy, they are very time consuming when performed the classical way; hence the price for a marginal improvement of inventory accuracy is steep.
Phantomscan, in contrast, leverages
advance statistical analysis to fine-tune the prioritization of inventory controls in order to make most of every minute spent counting, starting with items that need recount the most. Phantomscan
predicts the accuracy of each inventory record.
PhantomScan differs from both
inventory forecasting and from
out-of-shelf detection. Phantomscan helps retailers prioritize their inventory controls. In contrast inventory forecasting assumes that inventory records are correct, while Shelfcheck reacts to all problems causing sales drops. Those three apps are complementary.
How does Phantomscan work?
The challenge addressed by Phantomscan is simple:
each minute spent recounting inventory should yield the maximal amount of inventory corrections; hence maximizing the ROI of the inventory audit policy.
Traditional audit policies leverage rather naive methods, such as
ABC analysis, focusing the bulk of the counting effort on highly rotating items. However, we have found that those policies are inefficient in their use of manpower.
Phantomscan analyzes all
past inventory corrections to predict which are the items that truly need immediate recount. Indeed, inventory inaccuracies do not happen at random, but follow many patterns:
- certain categories are much more sensitive to inventory errors than others,
- events such as promotions may generate a surge of inaccuracies,
- counting itself may infrequently introduces very large inaccuracies,
The analysis of the problems observed in the past allows Phantomscan to accurately pinpoint areas that need the most counting efforts, and allows to optimize the frequency of recounts as well.
Moreover, Phantomscan
maximizes productivity by focusing on
items that happen to have a low expected stock on hand at the time of the recount. Indeed, the time needed to perform a recount is almost proportional to the number of units to be accounted for. Hence, in order to maximize employee productivity, Phantomscan takes into account the expected amount of time that the recount will require.
Getting started
Phantomscan is still in limited beta stage. In order to get started with the product you will need to get in contact with us. Just drop an email to
contact@lokad.com.
Data required for Phantomscan (the more depth in the history, the better the analytics). The data is typically sent to Lokad with daily rolling updates:
- (required) Quantities sold per store per product.
- (required) Inventory levels per store per product.
- (required) List of inventory corrections.
- (required) Product catalog listing, with families, sub-families...
- (optional) Replenishments per store per product.
- (optional) Promotion flags per store per product.
Patterns observed in store replenishments can help more accurately predict inventory inaccuracies. Similarly, promotions tend to generate extra inventory inaccuracies.
The data is transferred to Lokad through flat files (TSV) over FTP. We typically start with a proof-of-concept (POC) for a single, or a few, stores.
References
(1) DeHoratius, N. and A. Raman (2004). “Inventory Record Inaccuracy: An Empirical Analysis.” University of Chicago Graduate School of Business Working Paper.
(2) Thomas W. Gruen, Ph.D., University of Colorado at Colorado Springs, USA and Dr. Daniel Corsten, IE Business School Madrid (2008). “A Comprehensive Guide To Retail Out-of-Stock Reduction In the Fast-Moving Consumer Goods Industry”
Although computerized tracking of inventory at the stock keeping unit (SKU) level is commonly assumed to be accurate, we found discrepancies in 65% of the nearly 370,000 inventory records we gathered from multiple stores of a leading retail chain. DeHoratius and Raman (2004)
15% percent of Gamma’s inventory records, nearly 55,000 of them, had an absolute error of eight units or greater, more than half the average target quantity of inventory maintained on the shelf for that SKU in a given store. In aggregate, the value of the inventory reflected by these inaccurate records amounted to 28% of the total value of the expected onhand inventory. DeHoratius and Raman (2004)
We identified a variety of store issues that create perpetual inventory system inaccuracy (especially on hands). The level of perpetual inventory inaccuracy was stunning, as perpetual inventory accuracy (where the perpetual inventory exactly matched the on-hands) ranged from 32 percent to 45 percent in the four studies we conducted or examined. Gruen and Corsten (2008)