By Joannès Vermorel, February 2012The pinball loss function, also referred to as the quantile loss, is a metric used to assess the accuracy of a quantile forecast.
Evaluating the
accuracy of a
quantile forecast is a subtle problem. Indeed, contrary to the classic forecasts where the goal is to have the forecast as close as possible from the observed values, the situation is
biased (on purpose) when it comes to quantile forecasts. Hence the naive comparison
observed vs
forecasts is not satisfying. The
pinball loss function returns a value that can be interpreted as the
accuracy of a quantile forecasting model.
Formula
Let $\tau$ be the target quantile, $y$ the real value and $z$ the quantile forecast, then $L_\tau$, the pinball loss function, can be written:
$$
\begin{eqnarray}
L_{\tau}(y,z) & = & (y - z) \tau & \textrm{ if } y \geq z \\\
& = & (z - y) (1 - \tau) & \textrm{ if } z > y
\end{eqnarray}
$$
Download: pinball-loss-function.xlsxThe spreadsheet illustrates how to compute the pinball loss function within Microsoft Excel. The actual formula is no more complicated that most accuracy indicators such as a the MAPE.
Illustration

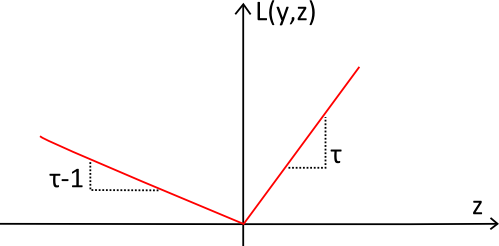
The pinball loss function (in red) has been named after its shape that looks like the trajectory of a ball on a
pinball. The function is always positive and the further away from the target $y$, the larger the value of $L_\tau(y,z)$. The
slope is used to reflect the
desired imbalance in the quantile forecast.
Best quantile model has lowest pinball loss
The most important result associated with the pinball loss function is that
the lower the pinball loss, the more accurate the quantile forecast.
It can be proved that the function that minimizes the pinball loss delivers the optimal quantile as well. However, the formalism required for the proof goes beyond the scope of this article.
Hence, in order to compare the respective accuracy of two quantile models (say Lokad vs other), it is sufficient to compute the
average pinball loss of each model over a number of time-series sufficiently large to make sure that the observed difference is statistically significant. In practice, a few hundred time-series are sufficient to assess which quantile model is the most
accurate.
Lokad's gotcha
The supposed
simplicity of the notion of accuracy for a classical forecast (i.e. mean forecast) is mostly overrated in our opinion. Forecasts, mean and quantile alike, are subject to overfitting which vastly complicates the comparison of forecasting models. However, the pinball loss function constitutes a very simple way to assess the
relative accuracy two quantile forecasting models.
Further reading
- Sequential Quantile Prediction of Time Series, March 2011, by Gerard Biau and Benoit Patra, Information Theory, IEEE Transactions
- Continuous Ranked Probability Score (CRPS), a generalization of pinball loss function for probabilistic forecasts
