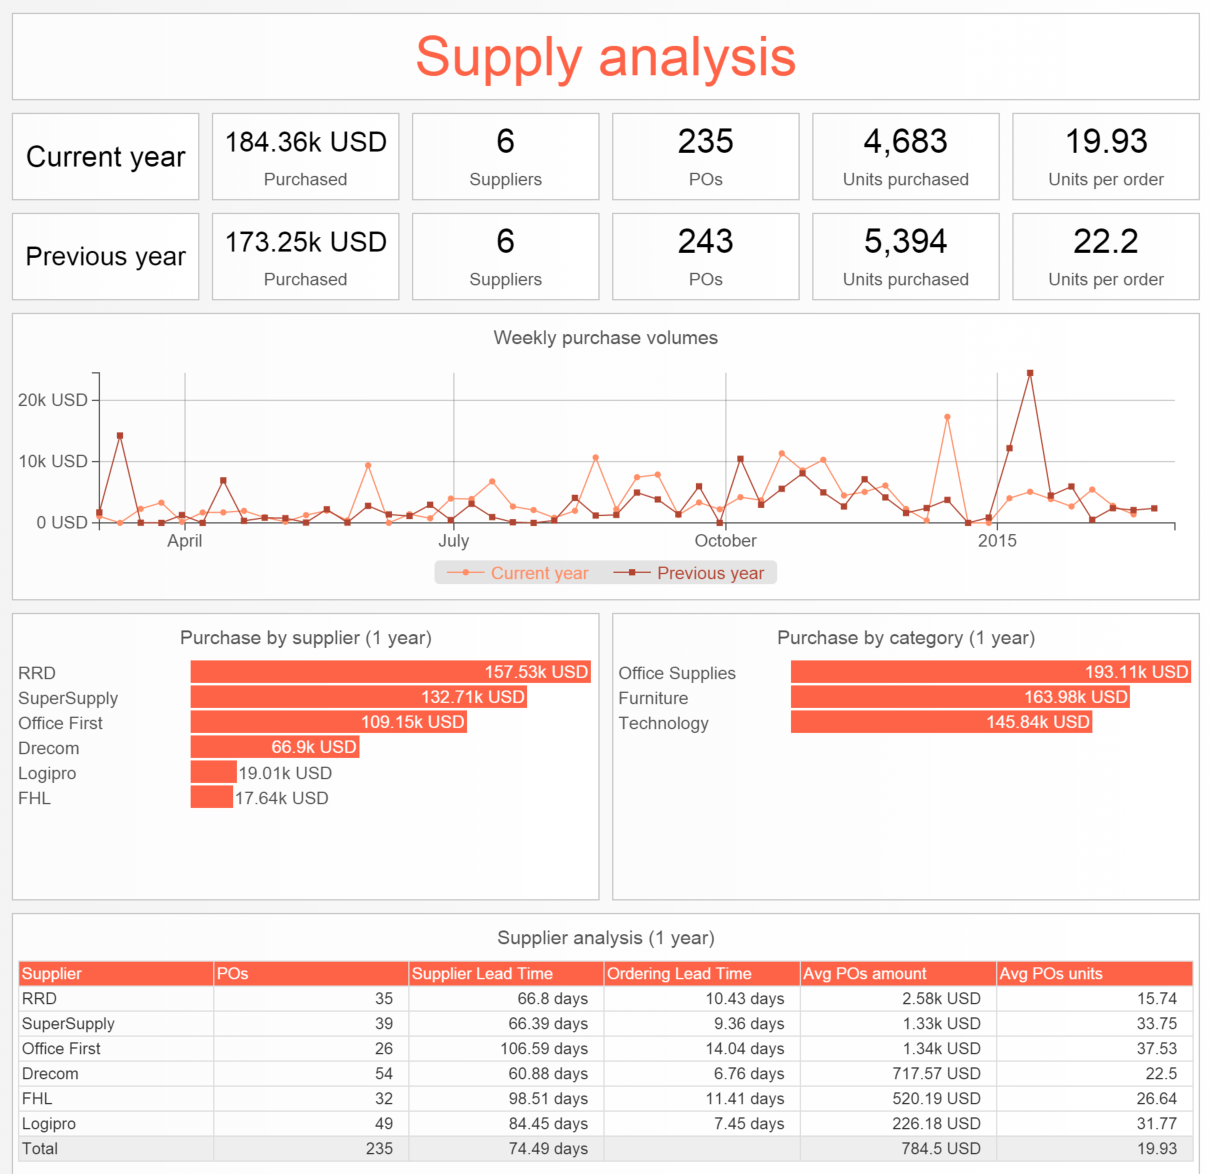
使用 Envision 进行供应商分析的示例
首页 » 资源 » 此处
下面的脚本说明了使用 Envision 构建供应商分析仪表板的过程。

read "/sample/Lokad_Items.tsv"
read "/sample/Lokad_Orders.tsv" as Orders
read "/sample/Lokad_PurchaseOrders.tsv" as PO

show label "Supply analysis" a1f1 tomato

PO.OrderId = "\{PO.Date}-\{PO.Supplier}"
oend := max(Orders.Date)

// Default currency, and currency conversions
when date >= oend - 365
currency := mode(Orders.Currency)
Orders.NetAmount = forex(Orders.NetAmount, Orders.Currency, currency, Orders.Date)
PO.NetAmount = forex(PO.NetAmount, \
PO.Currency, currency, PO.Date)

// Top KPIs
show label "Current year" a2
when date >= oend - 365
show table "Purchased { \{currency}}" b2 with sum(PO.NetAmount)
show table "Suppliers" c2 with distinct(PO.Supplier)
show table "POs" d2 with distinct(PO.OrderId)
show table "Units purchased" e2 with sum(PO.Quantity)
show table "Units per order" f2 with
avg(sum(PO.Quantity) by PO.OrderId)

show label "Previous year" a2
when date >= oend - 2 * 365 & date < oend - 365
show table "Purchased { \{currency}}" b3 with sum(PO.NetAmount)
show table "Suppliers" c3 with distinct(PO.Supplier)
show table "POs" d3 with distinct(PO.OrderId)
show table "Units purchased" e3 with sum(PO.Quantity)
show table "Units per order" f3 with
avg(sum(PO.Quantity) by PO.OrderId)

// Linecharts
Week.purchased := sum(PO.NetAmount)
when date < monday(oend) & date >= monday(oend) - 7 * 52
show linechart "Weekly purchase volumes{ \{currency}}" a4f6 tomato with
Week.purchased as "Current year"
Week.purchased[-52] as "Previous year"

// Split by supplier
show barchart "Purchase by supplier (1 year){ \{currency}}" a7c9 tomato with
sum(PO.NetAmount)
group by PO.Supplier

show barchart "Purchase by category (1 year){ \{currency}}" d7f9 tomato with
sum(PO.NetAmount)
group by Category

// Supplier analysis with lead times
when date >= oend - 365
where PO.DeliveryDate >= PO.Date // delivered PO only
show table "Supplier analysis (1 year)" a10f13 tomato with
PO.Supplier as "Supplier"
distinct(PO.OrderId) as "POs"
avg(mode(PO.DeliveryDate - PO.Date) \
by PO.OrderId) as "Supplier Lead Time{ days}"
365 / distinct(PO.OrderId) as "Ordering Lead Time{ days}"
avg(sum(PO.NetAmount) \
by PO.OrderId) as "Avg POs amount{ \{currency}}"
avg(sum(PO.Quantity) by PO.OrderId) as "Avg POs units"
group by PO.Supplier
order by sum(PO.NetAmount) desc